Managing the Greyhound Racing Surface

Managing the Greyhound Racing Surface 

Part One

Understanding the Greyhound Racing Gallop


Robert L. Gillette, DVM, MSE

The most important element of canine sports medicine is recognizing the athleticism of the patient


To prepare the racing surface for the Greyhound, it is important to understand how the Greyhound will interact with the surface.  Understanding this interaction begins by understanding the movements and forces related to Greyhound racing.


Canine Locomotion

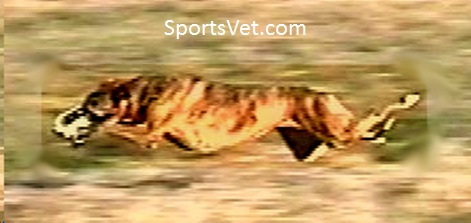
The gait describes a particular series of leg and body movements used for locomotion.  A Greyhound racing stride is seen in Figure 1.

  • A gait is made up of a series of repeated strides. 
  • A stride is defined as the cycle of body movements that begins with the contact of one foot and ends when that foot again contacts the ground. 
  • A dog stride is a summation of the combined step cycles of the four legs.

Figure 1.  The Greyhound racing stride is defined as a double-suspension rotary gallop.  It includes two support phases and two flight phases.


The Dog Step Cycle

A stride is composed of the summed movements of the four legs.  The phases of limb movement are divided into components of the step cycle.  Each leg goes through it’s own step cycle.  The stance phase and the swing phase make up the step cycle.

  • Stance Phase – The period that the foot is in contact with the ground.
  • Swing Phase – The period that the foot is swinging in the air.

Each leg of the dog goes through the same step cycle for every gait (Figure 2).

    • G1 – Paw Touchdown
    • G2 – Weight Transfer
    • G3 – Paw Push-Off
    • S1 – Initial Rearward Swing
    • S2 – Forward Swing
    • S3 – Final Rearward Swing

    Figure 2.  The step cycle is made up the stance phase and the swing phase.  The stance phase is made up three components: G1 – Paw Touchdown; G2 – Weight Transfer; G3 – Paw Push-Off.  The swing phase is also made up of three components: S1 – Initial Rearward Swing; S2 – Forward swing; S3 – Final Rearward Swing.


    Gaits

    A gait is a description of the combined movements of the legs and the resultant movements of the body.  There are symmetrical gaits and asymmetrical gaits.  In a symmetrical gait the movements of the right side mirrors the movements of the left side.  Examples of symmetrical gaits are the Trot, Pace, or Walk  In an asymmetrical gait the movement of one side is different than the other side.  Examples of an asymmetrical gait are the gallop or canter.

    The Greyhound Racing Gallop

    The gallop is the gait typically used by dogs that are running at high speeds. It has two support phases and two flight phases in each stride.  The gallop can have either a right lead or a left lead and is described as a double suspension-rotary gallop.  It is the running gait used by most dogs.

    The Gallop Sequence

    In left-lead dogs, the feet contact the surface in a clockwise fashion (Figure 3).  The left front leg comes into contact first, followed by the right front foot in the front support phase.  The dog then leaves the ground in the front flight phase.  The next foot to make contact is the right rear foot followed by the left rear foot in the rear support phase.  The dog then propels forward leaving the ground a second time in the rear flight phase, after which the sequence is again repeated.  A right-lead dog goes though the same sequence but contact is in a counter-clockwise rotation.

    Figure 3.  A stride sequence of the Greyhound racing gait.  A typical greyhound will go through 3 strides per second.The actions and definitions during the gallop sequence

    • Lead leg touchdown
    • Front leg absorbs the braking forces
    • Approximately 2.25 times the body weight absorbed by this limb
    • Front support phase
    • Off-lead front limb touchdown
    • Front support phase
    • In the turn away from the off-lead leg, this is the leg that is used the most for navigation
    • The right front leg in the racing Greyhound
    • Front flight phase
    • No legs in contact with the ground
    • Body suspended in air
    • First rear leg touchdown
    • Rear support phase
    • This initiates the spring affect of the lumbar and rear leg structures
    • The spring affect decreases as the greyhound fatigues
    • Second rear leg touchdown
    • Dual rear leg support
    • Rear support phase
    • The greatest amount of propulsion occurs at this time.
    • Rear leg push-off
    • Rear support phase
    • The last actions of navigation occur
    • Rear flight phase
    • No legs in contact with the ground
    • Body suspended in air
    • The sequence begins again


    The  Variations of Normal Canine Locomotion

    The forces involved with locomotion vary depending upon the particular movements.  The movements that occur during a race include:

    • Movement initiation
    • Straightaway running
    • Turning 
    • Braking

    Planes of MovementMovement can be measured in three planes.

    • “Z” movement or forces are up and down from the ground.
    • “X” movement is right and left or medial and lateral.
    • “Y” movement is back and forth or fore and aft.

    Movement Initiation

    Starting
    This applies to any dog that is initiating locomotion.

    • Energy is used to propel the  dog up and forward
    • This energy is produced mostly by the muscles of the back legs and lumbar segment of the axial skeleton
    • There are minimal impact forces

    Straight Locomotion

    Straight forward movement

    • Most of the forward movement is initiated by the rear end
    • This is dependent upon the type of gait and the speed of the dog
    • Most of the forces that act upon the dog are in the Y and Z planes

    Turning

    Navigation

    • The body uses various muscles to alter direction of movement
    • These directional changes place many different forces upon the dog’s structure
    • There is a big increase in the forces of the X plane

    Stopping or Braking

    Braking

    • This applies to any dog that is stopping or slowing down locomotion.
    • Energy is used to slow the dog’s forward progression.
    • Most of this energy is absorbed by the front legs
    • There are maximal braking forces

    Biomechanics of the Greyhound Racing Gallop

    Determination of a Kinematic Reference Base

    Introduction

    A study was performed in 1990 by Drs. Carol Zebas and Rob Gillette to determine the kinematic values associated with the Racing Greyhound.  This data could then be used to help reduce racing injuries.  Greyhounds were filmed during schooling races at the Woodlands Greyhound Track in Kansas City, Kansas.  The schooling races took place during the month of August prior to initiating the racing season.  Twenty-two Greyhounds were filmed for analysis.  This group of Greyhounds varied in ability from Grade A to Maidens.

    The Kinematic Factors Related to the Racing Gallop

    These factors are measured in distance or time (Figure 4).  Examples of Distance measurements are Stride Length, Flight Distance.  Examples of Time measurements are Stride Time, Support Time (Front, Rear, & Total), and Flight Time (Front, Rear, and Total).  Stride Frequency is a factor of stride time and is the number of strides taken per second of time

    Figure 4.  Divisions of the Greyhound Racing Stride.  They are defined as the front support (FS), front flight (FF), rear support (RS), and Rear Flight (RF).Kinematic Time Measurements

    The time data can been seen in Table 1. The Stride Time is the amount of time it took for the greyhound to go through one stride.  The average stride time was 0.33 seconds.  Therefore the Stride Frequency is 3 strides per second. The support time (ST = FS + RS) is the time spent in support during one stride.  The flight time (FT = FF + RF) is the time spent in flight during one stride.  FS is the time spent in front support during one stride, FF is the time spent in front flight, RS is the time spent in rear support, and RF is the time spent in rear flight.  The ratios help to evaluate support to flight values

    Table 1. Mean kinematic values of the Greyhound racing gait related to time.

    All values are the mean or average values reported

    Stride Time Support Time Flight Time Front Support Front Flight Rear Support Rear Flight ST/FT FS/FF RS/RF
    0.33 s 0.22 s 0.11 s 0.11 s 0.05 s 0.11 s 0.06 s 1.98 2.07 2.01

    s = seconds; ST = Stride Time; FT = Flight Time; FS = Front Support; FF = Front Flight; RS = Rear Support; RF = Rear Flight

    Kinematic Distance Measurements

    The distance data can be seen in Table 2.  The Stride Length is the distance the greyhound traveled during one stride.  The Linear Velocity is the speed that the Greyhound was traveling (16.93 m/s = 37.64 mph).  Vertical Movement is the distance that an object moves up and down.  The Trunk relates to the body or trunk and the Head relates to the head bob.  Range of motion (ROM) is the angular displacement of a joint measured in degrees (deg).

    Table 2. Mean kinematic values of the Greyhound racing gait related to distance.

    Stride Length Linear Velocity Trunk Vertical Movement Head Vertical Movement Hip ROM Shoulder ROM
    4.92 m 16.93 m/s 0.07 m 0.32 m 184 deg 182 deg

    Kinematic factors related to velocity (speed)

    The data in Table 3 show that velocity is related to stride frequency, support time, front/rear support distance and time ratios, and rear flight time, and rear distance.  The faster greyhounds are the ones who have a short quick, strong support phase that has a properly balanced rear to front support ratio.  As stride frequency increases velocity increases (r=.76).  When support time (r=-.85) and support/flight (r=-.57) decrease, velocity increases.  A strong rear support phase is evident by rear flight time and distance.  As rear flight distance (r=.81) and rear flight time (r=.70) increase so does the velocity.   It should be mentioned that stride length is not significantly correlated with velocity (r=.40). 

    Greyhounds with a high stride frequency, low support time, proper rear/flight support ratio, and long rear flight times and distances have an advantage over greyhounds who do not.

    Table 3.  Correlation of temporal and distance characteristics during the support and flight phases with velocity.

    Characteristic     Mean  Correlation’s
    Velocity  16.93 m/s
    Stride length 5.21 m none
    Stride frequency 3.04  str/s + .76
    Support time .22 s – .85
    Flight time .11 s  none
    Support/Flight time ratio 1.98  -.57
    Forelegs support time .11 s none
    Rearlegs support time .11 s none
    Forelegs flight time .05 s none
    Rearlegs flight time .06 s none
    Forelegs flight distance 1.31 m none
    Rearlegs flight distance 2.45 m .81

    Kinematic Factors of Fatigue

    The data related to fatigue are seen in Table 4.  The results indicated significant decreases (p < .05) from beginning to end in velocity (VEL=16.45 to 14.58 m/s), stride frequency (SF=3.25 to 2.82 strides/second), and rear leg flight distance (RFD=2.50 to 2.32 m).  Significant increases (p < .05) were found in total support time (ST=.187 to .225 s), front leg support time (FST=.093 to .114 s), rear leg support time (RST=.093 to .116 s), and front leg flight distance (FFD=1.23 to .142 m).  No significant differences (p < .05) were found in stride length (SL) or total flight time (FT).  It was concluded that velocity decreased because SF decreased with little or no accompanying changes in SL.  It would appear the body absorbed more energy later in the race, which limited the amount of stored elastic energy available to project the dog forward.  This is evidenced by the fact that more time was spent on ground support than in flight.  Even though the push off generated by the back legs caused the front flight distance to increase, there was no overall increase in SL because the rear flight distance decreased.  This suggests a fatigue effect or the inefficient use of the stored elastic energy in the vertebral muscles of the back (longissimus muscles). These results are similar in pattern to human runners in long sprint races where SF and leg lift decreased, characterizing the fatigue state. 

    Table 4. Correlation of selected kinematic values with fatigue.

    Parameter Beginning End Significance
    Velocity
    16.45 m/s
    14.58 m/s
    S
    Stride Frequency
    3.25 str/s
    5.82 str/s
    S
    Stride Length
    5.06 m
    5.17 m
    NS
    Total Support Time
    0.187 s
    0.225 s
    S
    Total Flight Time
    0.122 s
    0.130 s
    NS
    Front Flight Distance
    1.23 m
    1.42 m
    S
    Rear Flight Distance
    2.50 m
    2.32 m
    S

    Statements Related to Greyhound Speed

    • Faster Greyhounds have higher stride frequencies, longer rear flight times, and longer rear flight distances.
    • Faster greyhounds make more efficient use of storage and release of elastic energy in the vertebral muscles.

    Summary

    The racing Greyhound travels at speeds of more than 40 miles per hour.  Their lead leg impacts the surface with 2.25 times their body weight.   Greyhounds go through three strides per second during a race event.  Each stride is made up of a series of body movements that act to propel the greyhound forward, turn the greyhound to the left, or slow down and stop the greyhound.  The paw to surface interaction allows these actions to occur.  Therefore, it is very important that the surface is prepared to handle the forces related to these actions.  The surface acts to absorb the forces of impact and then provides traction for the paw to grip the surface.  The proper racing surface will minimize racing injuries, help to delay fatigue, and optimize racing ability.


    References

    • Gillette, R. L. Track Surface Influences on the Racing Greyhound. Greyhound Review, April, 1992.
    • Gillette, R. L. and C. J. Zebas. A Kinematic and Kinetic Analysis of the Greyhound Racing Pattern. Technical report presented to the Kansas Racing Commission August 8, 1991.
    • Zebas, C. J., Gillette, R. L., Hailey, R. L., Schoeberl, T., Kratzer, G., & Joseph, Y (1991). Kinematic descriptors of the running gait in the greyhound athlete. In R. N. Marshall, G. A. Wood, B. C. Elliott, T. R. Ackland, & P. J. McNair (Eds.), XIIIth International Conference on Biomechanics (pp 469-470). Perth, Australia: University of Western Australia.
    • Zebas, C. J., R. L. Gillette, R. L. Hailey, Y. Joseph, & T. Schoeberl (1991). Selected kinematic differences in the running gait of the greyhound athlete during the beginning and end of the race. In C. L. Tant, P. E. Patterson, & S. L. York (Eds.), Biomechanics in Sport IX (pp 81-84). Ames, IA: Iowa State University.


    Feel free to e-mail us at: k9care@sportsvet.com